Even though Election Day is officially eleven days out, voting has started in Arizona and already 1,194,820 people have voted. That’s about 36% of the total number of people expected to vote this year. We have data on who those people are and we at Javelina have been pouring over the data each and every day to read any tea leaves that we can.
Here are our four major takeaways from Arizona’s ballot returns, eleven days out:
1. DEMOCRATIC RETURNS ARE LAGGING BEHIND 2020
As of today’s returns, Republicans have a 115k ballot return advantage over Democrats. This is a reversal of both 2020 and 2022, when Democrats significantly led early vote returns. Before 2020 though, Republicans tended to significantly lead the early vote because their voters were older and more likely to check their mail every day. It’s not clear whether this year’s differential is a sign of a return to pre-2020 voting patterns or a signal that Republicans are more energized than Democrats.
One complicating factor is that in 2022, a record number of voters dropped their early ballots off at polling places on election day. The 290,000 early ballots dropped off on election day 2022 in Maricopa County was a 70% increase over 2020. One theory is that lower propensity Democrats and Independents are waiting until election day to drop off their ballot at a polling place. I’m biased as a Democrat, but I think that with an extremely long ballot with more ballot measure questions than ever, it would make sense that these lower propensity voters would take their time to complete and return their ballot.
2. DEMOCRATIC RETURNS ARE HIGH WITH HIGHER PROPENSITY VOTERS (AND LOW WITH LOW PROPENSITY VOTERS)
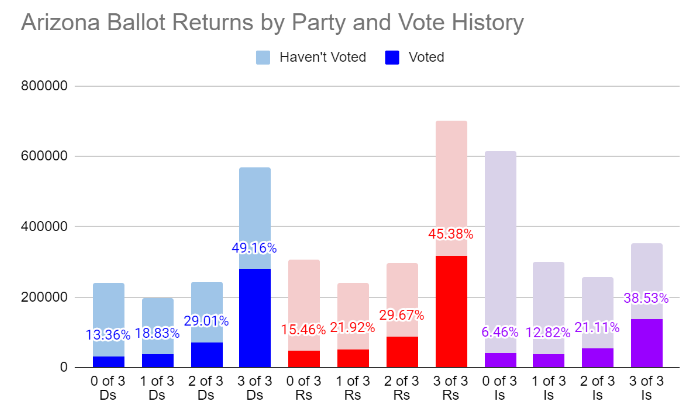
One of the figures I’m paying closest attention to is early ballot returns by voter frequency. I separate each voter into four categories based on whether or not they voted in the last three general elections. 3 of 3 voters participated in all three of the 2018, 2020, and 2022 general elections, 2 of 3 voters participated in two out of the three most recent general elections and so on and so forth.
In the table above, you can see the size of each one of those groups, and the percentage of those groups who have returned ballots so far. 3 of 3 voters are what we would describe as “high propensity” because they vote pretty much every time and we can basically count on them voting again this year. 3 of 3 Democrats are returning their ballots in droves, almost half of them have voted with eleven days left before election day – that’s the highest return rate of any group. However, with lower propensity voters, Republicans have a turnout advantage. This could signal that lower propensity Republicans are more excited to vote this year than their Democratic counterparts, or it could be a sign that lower propensity Democrats are holding onto their ballots to drop them off at the polls on election day.
3. WHAT ABOUT INDEPENDENTS?
Registered Independents and third parties voters make up more than a third of all registered voters in Arizona and they consistently swing elections in this battleground state. In both 2020 and 2022, Republicans had a statewide ballot advantage (4.7% in 2020 and 7.7% in 2022), nevertheless Arizona consistently elected Democrats statewide: Joe Biden for President, Mark Kelly for US Senate (twice), and Katie Hobbs for Governor because Independents have supported Democratic candidates so strongly. The 2020 exit polls estimate that registered Independents supported Joe Biden by a 53%-44% margin. How they break in 2024 will determine who wins the state this year between Kamala Harris and Donald Trump.
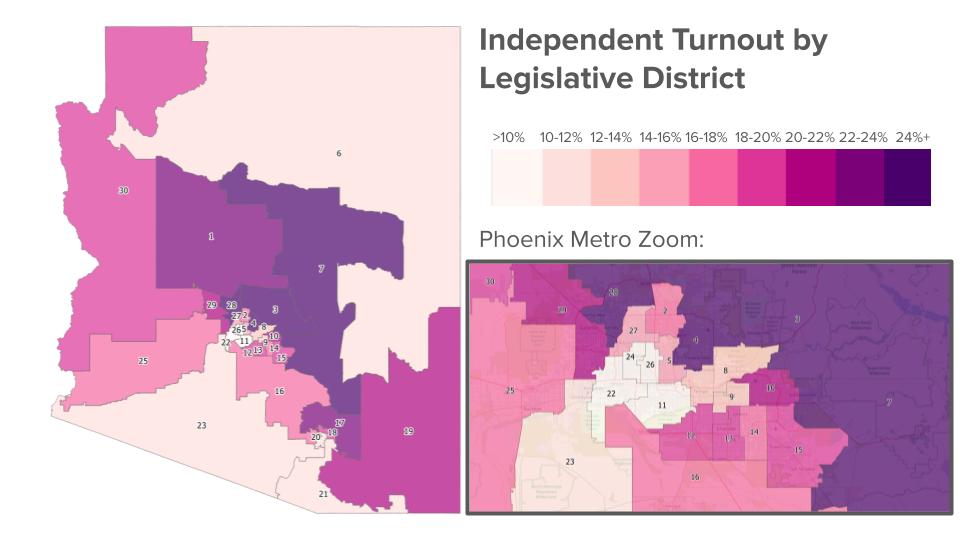
One thing we do know is that Independent voters tend to behave differently based on the environment around them. Independents in conservative regions of the state tend to support Republican candidates at a higher rate and Independents in more progressive regions of the state tend to support Democratic candidates at a higher rate. So, where is Independent turnout in Arizona highest?
The highest turnout for Independents comes in state legislative districts 3, 4, 7, and 28 – with turnout for Independents all over 24% in those districts. Unsurprisingly, these are also the districts with some of the highest percentages of voters age 65+. While 3, 7, and 28 are some of the most conservative districts in Arizona, 4 is one of the competitive districts – indicating that age may be the driving factor in turnout, not partisan leaning. Meanwhile, the districts with the lowest Independent turnout are 11, 22, 24, and 26. All of these districts are in the southwest valley and are some of the youngest and most Latino areas of the state.
4. LATINO TURNOUT
Speaking of the Latino vote, in 2020, exit polls estimated that 19% of all Arizona voters were Latino and those voters broke 61%-37% for Biden. That was a stronger performance than in some other battleground states. In Florida, Latinos only broke 53%-46% for Biden and in Texas, Latinos broke 58%-41% for Biden.
Today, our modeling shows that of the 1,194,820 only 12% are Latino and this matches the geographic map from earlier, which showed Independent turnout to be lowest in some areas of the state with the highest Latino population. This isn’t surprising though; Latinos are on average younger and more likely to be registered Independents than the median voter and those groups have always been more likely to vote later on in the process.
FINAL TAKEAWAYS
Polling indicates that the presidential race is extremely close and while the averages may move on the margins in one direction or the other, neither Kamala Harris nor Donald Trump has been able to maintain a lead in the swing states.
Early ballot returns indicate some good news for Republicans but voting patterns have shifted significantly during the last few cycles between the pandemic and Trump’s false conspiracy theories about mail-in voting, making it impossible to make any definitive predictions based on early voting numbers.
In Arizona, we’re unlikely to know who won the presidential contest until days after election day (read this article to find out why), but the most important number I’ll be looking to is how many people have dropped their early ballots off on election day. Will lower propensity Democrats drop their ballots off on election day, causing us to surpass the record breaking total of 2022 (I’m thinking yes) and how will those voters swing the preliminary results we have on election night?


